vue2中实现天气预报功能
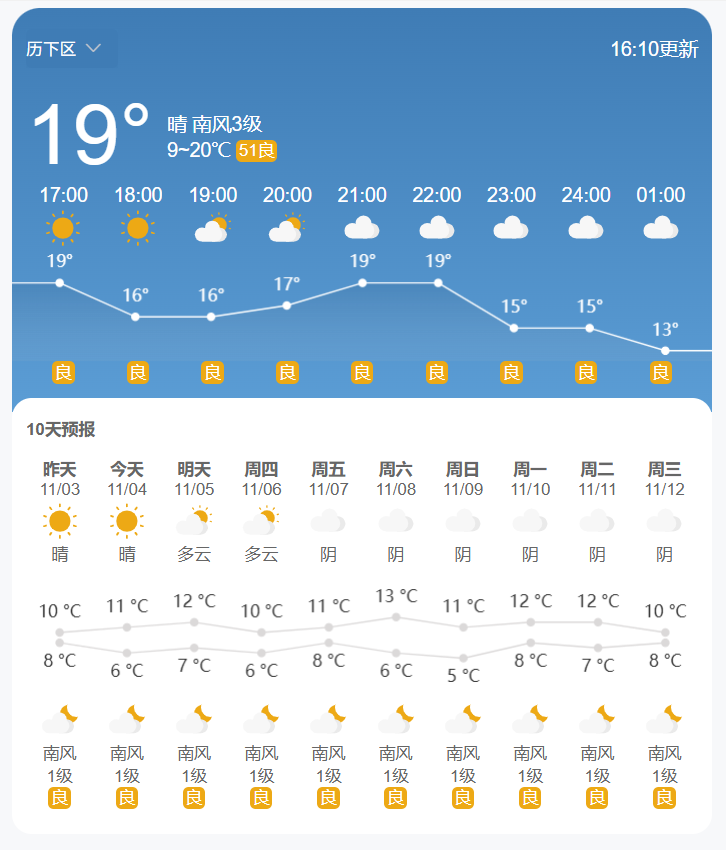
- 实现效果图
- 静态页完整代码
- echarts组件代码
- 最终实现页面渲染使用到的函数
-
- 年-月-日字符串转为 昨天、今天、明天、周几
实现效果图
静态页完整代码
1<template> 2 <div class="weather-container"> 3 <div class="weather-top"> 4 <!-- 市区选择和更新时间 --> 5 <p class="city-select padding-l-r-10"> 6 <el-select 7 v-model="selectDistrict" 8 size="mini" 9 placeholder="请选择" 10 class="select-district" 11 > 12 <el-option 13 v-for="item in districtOptions" 14 :key="item.value" 15 :label="item.label" 16 :value="item.value" 17 > 18 </el-option> 19 </el-select> 20 <span>16:10更新</span> 21 </p> 22 23 <!-- 当前温度情况 --> 24 <div class="current padding-l-r-10"> 25 <span class="temperature">19°</span> 26 <div class="current-situation"> 27 <div>晴 南风3级</div> 28 <div>9~20℃ <span class="quality">51良</span></div> 29 </div> 30 </div> 31 32 <!-- 气温时间点 --> 33 <div class="hourly padding-l-r-10"> 34 <div v-for="h in hourly" :key="h.time" class="cell"> 35 <div>{{ h.time }}</div> 36 <img class="icon" :src="h.status | weatherIcon" /> 37 </div> 38 </div> 39 40 <!-- 时间点温度折线图 --> 41 <div class="temperature-echart"> 42 <echartsIndex id="hourTemperature" :option="hourTemperatureOption" /> 43 </div> 44 45 <!-- 空气质量 --> 46 <div class="hourly padding-l-r-10"> 47 <div v-for="(q, i) in hourly" :key="i" class="cell"> 48 <div :class="q.quality | qualityClass">{{ q.quality }}</div> 49 </div> 50 </div> 51 </div> 52 <div class="weather-bottom"> 53 <div class="forecast-title font-weight"> 54 <span>10天预报</span> 55 <p> 56 <!-- <span>趋势</span> 57 / 58 <span>列表</span> --> 59 </p> 60 </div> 61 62 <!-- 10天天气情况 --> 63 <div class="weather-forecast"> 64 <div v-for="f in forecastData" :key="f.date" class="cell"> 65 <div class="font-weight">{{ f.day }}</div> 66 <div>{{ f.date }}</div> 67 <img class="icon" :src="f.daytimeState | weatherIcon" /> 68 <div>{{ f.daytimeState }}</div> 69 </div> 70 </div> 71 72 <!-- 10天最高温与最低温折线图 --> 73 <div class="temperature-echart"> 74 <echartsIndex id="temperatureRange" :option="temperatureRangeOption" /> 75 </div> 76 77 <!-- 风力情况 --> 78 <div class="wind-conditions"> 79 <div v-for="w in forecastData" :key="w.date" class="cell"> 80 <img class="icon" :src="w.nightState | weatherIcon" /> 81 <div class="direction">{{ w.direction }}</div> 82 <div class="level">{{ w.level }}级</div> 83 <div :class="w.quality | qualityClass">{{ w.quality }}</div> 84 </div> 85 </div> 86 </div> 87 </div> 88</template> 89 90<script> 91export default { 92 name: "Weather", 93 data() { 94 return { 95 // 区县 96 districtOptions: [ 97 { 98 value: "历下区", 99 label: "历下区", 100 }, 101 { 102 value: "历城区", 103 label: "历城区", 104 }, 105 { 106 value: "长清区", 107 label: "长清区", 108 }, 109 { 110 value: "莱芜区", 111 label: "莱芜区", 112 }, 113 ], 114 selectDistrict: "历下区", 115 // 当天时间点数据 116 hourly: [ 117 { time: "17:00", status: "晴", quality: "良" }, 118 { time: "18:00", status: "晴", quality: "良" }, 119 { time: "19:00", status: "多云", quality: "良" }, 120 { time: "20:00", status: "多云", quality: "良" }, 121 { time: "21:00", status: "阴", quality: "良" }, 122 { time: "22:00", status: "阴", quality: "良" }, 123 { time: "23:00", status: "阴", quality: "良" }, 124 { time: "24:00", status: "阴", quality: "良" }, 125 { time: "01:00", status: "阴", quality: "良" }, 126 ], 127 // 未来10天天气数据 128 forecastData: [ 129 { 130 day: "昨天", 131 date: "11/03", 132 daytimeState: "晴", 133 nightState: "夜多云", 134 direction: "南风", 135 level: "1", 136 quality: "良", 137 }, 138 { 139 day: "今天", 140 date: "11/04", 141 daytimeState: "晴", 142 nightState: "夜多云", 143 direction: "南风", 144 level: "1", 145 quality: "良", 146 }, 147 { 148 day: "明天", 149 date: "11/05", 150 daytimeState: "多云", 151 nightState: "夜多云", 152 direction: "南风", 153 level: "1", 154 quality: "良", 155 }, 156 { 157 day: "周四", 158 date: "11/06", 159 daytimeState: "多云", 160 nightState: "夜多云", 161 direction: "南风", 162 level: "1", 163 quality: "良", 164 }, 165 { 166 day: "周五", 167 date: "11/07", 168 daytimeState: "阴", 169 nightState: "夜多云", 170 direction: "南风", 171 level: "1", 172 quality: "良", 173 }, 174 { 175 day: "周六", 176 date: "11/08", 177 daytimeState: "阴", 178 nightState: "夜多云", 179 direction: "南风", 180 level: "1", 181 quality: "良", 182 }, 183 { 184 day: "周日", 185 date: "11/09", 186 daytimeState: "阴", 187 nightState: "夜多云", 188 direction: "南风", 189 level: "1", 190 quality: "良", 191 }, 192 { 193 day: "周一", 194 date: "11/10", 195 daytimeState: "阴", 196 nightState: "夜多云", 197 direction: "南风", 198 level: "1", 199 quality: "良", 200 }, 201 { 202 day: "周二", 203 date: "11/11", 204 daytimeState: "阴", 205 nightState: "夜多云", 206 direction: "南风", 207 level: "1", 208 quality: "良", 209 }, 210 { 211 day: "周三", 212 date: "11/12", 213 daytimeState: "阴", 214 nightState: "夜多云", 215 direction: "南风", 216 level: "1", 217 quality: "良", 218 }, 219 ], 220 hourTemperatureOption: { 221 xAxis: { 222 type: "category", 223 boundaryGap: false, 224 splitLine: { show: false }, 225 axisLine: { show: false }, 226 axisTick: { show: false }, 227 axisLabel: { show: false }, 228 data: [], 229 }, 230 yAxis: { 231 splitLine: { show: false }, 232 axisLine: { show: false }, 233 axisTick: { show: false }, 234 axisLabel: { show: false }, 235 min: 13, 236 max: 22, 237 }, 238 series: [ 239 { 240 name: "温度折线", 241 type: "line", 242 smooth: false, // 平滑曲线 243 symbol: "circle", // 圆点标记 244 symbolSize: 6, // 标记大小 245 data: [], 246 lineStyle: { 247 color: "#fff", // 白色折线 248 width: 1, 249 }, 250 itemStyle: { 251 color: "#fff", // 白色标记点 252 }, 253 areaStyle: { 254 // 新增:折线下方填充半透明蓝色,模拟图中区域 255 color: { 256 type: "linear", 257 x: 0, 258 y: 0, 259 x2: 0, 260 y2: 1, 261 colorStops: [ 262 { 263 offset: 0, 264 color: "rgba(41, 87, 129, .3)", // 上半部分透明 265 }, 266 { 267 offset: 1, 268 color: "rgba(201, 198, 198, 0.1)", // 下半部分更透明 269 }, 270 ], 271 }, 272 }, 273 label: { 274 show: true, 275 position: "top", 276 color: "#fff", // 白色文字 277 formatter: "{c}°", // 温度格式 278 }, 279 }, 280 ], 281 // 新增:隐藏图例、工具箱等无关元素 282 legend: { show: false }, 283 toolbox: { show: false }, 284 grid: { 285 left: "-20px", 286 right: "-20px", 287 top: 0, 288 bottom: 0, 289 containLabel: false, 290 }, 291 }, 292 temperatureRangeOption: { 293 grid: { 294 left: 0, 295 right: 0, 296 top: 0, 297 bottom: 0, 298 containLabel: false, 299 }, 300 xAxis: { 301 type: "category", 302 boundaryGap: true, 303 splitLine: { 304 show: false, 305 }, 306 // 去除坐标轴线 307 axisLine: { 308 show: false, 309 }, 310 // 去除坐标轴刻度 311 axisTick: { 312 show: false, 313 }, 314 // 隐藏坐标轴数值 315 axisLabel: { 316 show: false, 317 }, 318 }, 319 yAxis: { 320 splitLine: { 321 show: false, 322 }, 323 // 去除坐标轴线 324 axisLine: { 325 show: false, 326 }, 327 // 去除坐标轴刻度 328 axisTick: { 329 show: false, 330 }, 331 // 隐藏坐标轴数值 332 axisLabel: { 333 show: false, 334 }, 335 }, 336 337 labelLine: { 338 show: false, 339 }, 340 series: [ 341 { 342 name: "实线", 343 type: "line", 344 smooth: false, 345 symbol: "circle", // 圆点标记 346 symbolSize: 6, // 标记大小 347 data: [], 348 lineStyle: { 349 color: "#dbd9d9", 350 width: 1, 351 }, 352 itemStyle: { 353 color: "#dbd9d9", // 白色标记点 354 }, 355 label: { 356 show: true, 357 position: "top", 358 formatter: "{c} °C", 359 }, 360 }, 361 { 362 name: "虚线", 363 type: "line", 364 smooth: false, 365 symbol: "circle", // 圆点标记 366 symbolSize: 6, // 标记大小 367 data: [], 368 lineStyle: { 369 color: "#dbd9d9", 370 width: 1, 371 // type: "dashed", 372 }, 373 itemStyle: { 374 color: "#dbd9d9", // 白色标记点 375 }, 376 label: { 377 show: true, 378 position: "bottom", 379 formatter: "{c} °C", 380 }, 381 }, 382 ], 383 }, 384 }; 385 }, 386 filters: { 387 weatherIcon(name) { 388 // 防止关键字里带“雷阵雨”等罕见词,没有文件就回落到“晴” 389 try { 390 return require([`@/assets/weatherIcons/${name}.svg`](https://xplanc.org/primers/document/zh/03.HTML/EX.HTML%20%E5%85%83%E7%B4%A0/EX.svg.md)); 391 } catch { 392 return require([`@/assets/weatherIcons/晴.svg`](https://xplanc.org/primers/document/zh/03.HTML/EX.HTML%20%E5%85%83%E7%B4%A0/EX.svg.md)); 393 } 394 }, 395 qualityClass(val) { 396 if (val === "轻度") return ["quality", "mild"]; 397 return ["quality"]; // 良或其它 398 }, 399 }, 400 mounted() { 401 // 模拟数据 402 // 当天天气数据 403 const currentData = [ 404 { 405 time: "现在", 406 temperature: 19, 407 }, 408 { 409 time: "17:00", 410 temperature: 16, 411 }, 412 { 413 time: "18:00", 414 temperature: 16, 415 }, 416 { 417 time: "19:00", 418 temperature: 17, 419 }, 420 { 421 time: "20:00", 422 temperature: 19, 423 }, 424 { 425 temperature: 19, 426 time: "21:00", 427 }, 428 { 429 time: "22:00", 430 temperature: 15, 431 }, 432 { 433 time: "23:00", 434 temperature: 15, 435 }, 436 { 437 time: "11/05", 438 temperature: 13, 439 }, 440 ]; 441 442 let times = []; 443 let temperatures = []; 444 445 currentData.forEach((item) => { 446 times.push(item.time); 447 temperatures.push(item.temperature); 448 }); 449 // 头尾各重复一次数据,简单外插实现折线图两边留白的效果 450 temperatures = [ 451 temperatures[0], 452 ...temperatures, 453 temperatures[temperatures.length - 1], 454 ]; 455 const hourTemperatureOptionMax = Math.max(...temperatures); 456 const hourTemperatureOptionMin = Math.min(...temperatures); 457 this.hourTemperatureOption.yAxis.min = hourTemperatureOptionMin - 1; // 最小温度值 - 1 458 this.hourTemperatureOption.yAxis.max = hourTemperatureOptionMax + 3; // 最大温度值 + 3 459 this.hourTemperatureOption.xAxis.data = ["", ...times, ""]; // 补充x轴两边的数据 460 // 两边的拐点不做展示 461 this.hourTemperatureOption.series[0].data = temperatures.map( 462 (val, idx) => ({ 463 value: val, 464 symbol: 465 idx === 0 || idx === temperatures.length - 1 ? "none" : "circle", 466 }) 467 ); 468 469 // 未来10天天气数据 470 const data1 = [10, 11, 12, 10, 11, 13, 11, 12, 12, 10]; 471 const data2 = [8, 6, 7, 6, 8, 6, 5, 8, 7, 8]; 472 this.temperatureRangeOption.series[0].data = data1; 473 this.temperatureRangeOption.series[1].data = data2; 474 const all = [...data1, ...data2]; 475 this.temperatureRangeOption.yAxis.min = Math.min(...all) - 6; // 最小温度值 - 6 476 this.temperatureRangeOption.yAxis.max = Math.max(...all) + 8; // 最大温度值 + 8 477 }, 478}; 479</script> 480 481<style lang="scss" scoped> 482.weather-container { 483 width: 500px; 484 font-size: 14px; 485 .weather-top { 486 padding: 1px 0 20px; 487 background: linear-gradient(to bottom, #3f7cb5, #5b9dd5); 488 border-radius: 20px 20px 0 0; 489 box-sizing: border-box; 490 color: #fff; 491 492 .padding-l-r-10 { 493 padding: 0 10px; 494 } 495 496 .city-select { 497 display: flex; 498 justify-content: space-between; 499 align-items: center; 500 501 .select-district { 502 width: 66px; 503 background-color: #417fb8; 504 505 ::v-deep .el-input--mini .el-input__inner { 506 background: #3f7cb5; 507 color: #fff; 508 border: none; 509 padding-left: 0; 510 } 511 } 512 } 513 514 .current { 515 display: flex; 516 justify-content: flex-start; 517 align-items: center; 518 519 .temperature { 520 font-size: 60px; 521 margin-right: 10px; 522 } 523 524 .current-situation { 525 display: flex; 526 flex-direction: column; 527 justify-content: flex-start; 528 font-size: 14px; 529 } 530 } 531 532 .hourly { 533 display: flex; 534 overflow-x: auto; 535 } 536 } 537 538 .weather-bottom { 539 background: #fff; 540 margin-top: -10px; 541 border-radius: 14px; 542 padding: 10px; 543 color: #666; 544 font-size: 12px; 545 .forecast-title { 546 display: flex; 547 justify-content: space-between; 548 align-items: center; 549 } 550 551 .weather-forecast, 552 .wind-conditions { 553 display: flex; 554 overflow-x: auto; 555 padding: 8px 0; 556 } 557 } 558 559 .temperature-echart { 560 width: 100%; 561 height: 80px; 562 } 563 564 .cell { 565 width: 12%; 566 display: flex; 567 flex-direction: column; 568 align-items: center; 569 } 570 571 .quality { 572 border-radius: 4px; 573 line-height: 14px; 574 text-align: center; 575 padding: 1px 2px; 576 background-color: #eda915; 577 color: #fff; 578 font-size: 12px; 579 580 &.mild { 581 background-color: orange; 582 } 583 } 584 585 .font-weight { 586 font-weight: bold; 587 } 588 589 .icon { 590 width: 30px; 591 height: auto; 592 } 593} 594</style> 595
echarts组件代码
1<template>
2  <div :id="id" class="echart-box"></div>
3</template>
4
5<script>
6import * as echarts from "echarts";
7export default {
8  name: "echartsIndex",
9  props: {
10    id: {
11      type: String,
12      required: true,
13    },
14    option: {
15      type: Object,
16      default: () => {},
17      required: true,
18    },
19  },
20  data() {
21    return {
22      myChart: null,
23      observer: null,
24    };
25  },
26  watch: {
27    echartsData() {
28      this.$nextTick(this.drawLine);
29    },
30  },
31  mounted() {
32    this.$nextTick(() => {
33      this.drawLine();
34      const dom = document.getElementById(this.id);
35      if (!dom) return;
36      if (window.ResizeObserver) {
37        this.observer?.disconnect();
38        this.observer = new ResizeObserver(() => this.myChart?.resize());
39        this.observer.observe(dom);
40      } else {
41        this.resizeHandler = () => this.myChart?.resize();
42        window.addEventListener("resize", this.resizeHandler);
43      }
44    });
45  },
46  beforeDestroy() {
47    this.observer?.disconnect();
48    if (this.resizeHandler)
49      window.removeEventListener("resize", this.resizeHandler);
50    this.myChart?.dispose();
51  },
52  methods: {
53    drawLine(echartsData) {
54      if (!document.getElementById(this.id)) return;
55      this.myChart?.dispose();
56      this.myChart = echarts.init(document.getElementById(this.id));
57      this.myChart.setOption(this.option, true);
58      this.myChart.resize();
59      window.addEventListener("resize", this.resizeChart);
60    },
61    setOption(option) {
62      this.myChart.setOption(option, true);
63    },
64    showLoadingFun() {
65      if (this.myChart) {
66        this.myChart.showLoading();
67      }
68    },
69    hideLoadingFun() {
70      if (this.myChart) {
71        this.myChart.hideLoading();
72      }
73    },
74    resizeChart() {
75      if (this.myChart) {
76        this.myChart.resize();
77      }
78    },
79  },
80};
81</script>
82<style scoped>
83.echart-box {
84  width: 100%;
85  height: 100%;
86}
87</style>
88
最终实现页面渲染使用到的函数
年-月-日字符串转为 昨天、今天、明天、周几
1/**
2     * 将年-月-日字符串转为「昨天/今天/明天/周几」
3     * @param {string} mmdd - 11-12
4     * @returns {string}
5     */
6    formatDayLabel(dateStr) {
7      const rel = new Intl.RelativeTimeFormat("zh", { numeric: "auto" });
8      const target = new Date(dateStr.replace(/-/g, "/")); // 兼容 IOS
9      const today = new Date();
10      today.setHours(0, 0, 0, 0);
11      const diff = Math.round((target - today) / 864e5); // 相差天数
12
13      if (diff === -1) return "昨天";
14      if (diff === 0) return "今天";
15      if (diff === 1) return "明天";
16
17      // 其余返回「周一 … 周日」
18      const week = ["周日", "周一", "周二", "周三", "周四", "周五", "周六"];
19      return week[target.getDay()];
20    }
21
《vue2中实现天气预报》 是转载文章,点击查看原文。
